Force Layout Graph using D3 in Jekyll
Here’s an interactive force layout graph using D3 which allows us to position elements in a way that would be difficult to achieve using other means. Rather than simply going over the code and attaching an image of the result, I wanted to embed the D3 code into the Jekyll markdown file to make it interactive.
To start with, add the following to your _layouts/post.html file within the header tag. This will add D3 support to the markdown. Make sure you do not have d3 source code location mentioned within the script tag of your actual code - this may create version conflicts.
  <script src="https://code.jquery.com/jquery-2.2.3.min.js"></script>
  <script src="https://d3js.org/d3.v3.min.js"></script>
  <script src="https://d3js.org/queue.v1.min.js"></script>
  <script src="https://d3js.org/topojson.v1.min.js"></script>
  <script src="https://code.jquery.com/ui/1.11.4/jquery-ui.js"></script>
This is what the skeleton will look like. Note that we do not have a body tag. So if you append your SVG element to the body tag, your chart will not display. Instead create a div element before your script and append your SVG to this.
<head>
<style>
/*Any CSS styling goes here */
</style>
</head>
<div id=chart></div>
<script>
//Add data here if not in separate file
var svg = d3.select("#chart").append("svg")
.attr("width", width)
.attr("height", height);
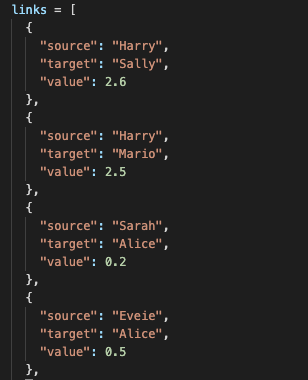
</script>I was having some trouble linking to an external file so in this case, the data is inside the javascript file - or script tag of html file - itself in a JSON format. This is a list of dictionaries where each dict has a source, target and value key.
Get the distinct nodes by iterating over the links data. We have added a D3 force function with a charge which simulates electrostatic effects across all nodes - it is negative since we want a repulsing force. We also add a callback function tick for every time the simulation iterates or when user interacts with the chart.
var nodes = {};
links.forEach(function(link) {
    link.source = nodes[link.source] ||
        (nodes[link.source] = {name: link.source});
    link.target = nodes[link.target] ||
        (nodes[link.target] = {name: link.target});

var force = d3.layout.force()
    .nodes(d3.values(nodes))
    .links(links)
    .size([width, height])
    .linkDistance(60)
    .charge(-150)
    .on("tick", tick)
    .start();

});
Create the link paths by binding the data to the path> SVG element which is the generic element to define a shape. The seemingly arbitrary numbers for the d attribute are defining the curvy lines between our nodes. The color of the link is set based on the ‘value’ field.
svg.append("svg:defs").selectAll("marker")
    .data(["end"])      // Different link/path types can be defined here
  .enter().append("svg:marker")    // This section adds in the arrows
    .attr("id", String)
    .attr("viewBox", "0 -5 10 10")
    .attr("refX", 15)
    .attr("refY", -1.5)
    .attr("markerWidth", 6)
    .attr("markerHeight", 6)
    .attr("orient", "auto")
  .append("svg:path")
    .attr("d", "M0,-5L10,0L0,5");
// add the links
var path = svg.append("svg:g").selectAll("path")
    .data(force.links())
  .enter().append("svg:path")
    .attr("class", function(d) { return "link " + d.type; });
path.style("stroke", function(link){
  if (link.value < 1) {return "blue";}
  if (link.value >= 1 & link.value <= 2) {return "green";}
  if (link.value > 2) {return "red";}
});
We define the D3 nodes and append to circle elements. We allow the nodes to be dragged by the user and also add a functionality to fix the nodes in place when double-clicked.
// define the nodes
var node = svg.selectAll(".node")
    .data(force.nodes())
    .enter().append("g")
    .attr("class", "node")
    .call(force.drag)
    .on("dblclick", function(d){
        if(d.fixed == false) {
          d3.select(this).selectAll("circle")
          .classed("pin", true)
          .classed("fixed", d.fixed = true);
        }
        else {
          d3.select(this).selectAll("circle")
          .classed("pin", false)
          .classed("fixed", d.fixed = false);
        }
        });
// add the nodes
node.append("circle")
    .attr("r", function(d){
        return (links.filter(function(p) {
          return(p.source == d | p.target == d);
        })).length;
    });
var label = node.append("text")
            .text(function(d) { return d.name; })
            .attr("dx", 10);
Finally define the tick function - this should update cordinates of the node and text labels. dx and dy are relative positiions of text to the nodes.
function tick() {
    path.attr("d", function(d) {
        var dx = d.target.x - d.source.x,
            dy = d.target.y - d.source.y,
            dr = Math.sqrt(dx * dx + dy * dy);
        return "M" +
            d.source.x + "," +
            d.source.y + "A" +
            dr + "," + dr + " 0 0,1 " +
            d.target.x + "," +
            d.target.y;
    });
    node
        .attr("transform", function(d) {
		    return "translate(" + d.x + "," + d.y + ")"; });
};
We have used D3 to create an interactive force directed layout graph with additional customizations. Hopefully this has convinced you to harness the visualization power of D3 for your next analysis!
This programming assignment was submitted as coursework for CSE6242 Data and Visual Analytics (Fall 2016), Georgia Tech College of Computing.